
Industry 4.0 is redefining how industrial networks behave and how they are operated. Industrial networks are mission-critical by nature and have always required timely delivery and deterministic behavior. With Industry 4.0, these networks are becoming artificial intelligence-based, automated and self-healing, as well. As part of this evolution, industrial networks are experiencing the convergence of two previously independent networks: information technology (IT) and operational technology (OT). Time Sensitive Networking (TSN) is facilitating this convergence by enabling the use of Ethernet standards-based deterministic latency to address the needs of both the IT and OT realms.
However, the transition to TSN brings new challenges and requires fresh solutions for industrial network visibility. In this blog, we will focus on the ways in which visibility tools are evolving to address the needs of both IT managers and those who operate the new time-sensitive networks.
Networks are at the heart of the industry 4.0 revolution, ensuring nonstop industrial automation operation. These industrial networks operate 24/7, frequently in remote locations with minimal human presence. The primary users of the industrial network are not humans but, rather, machines that cannot “open tickets.” And, of course, these machines are even more diverse than their human analogs. Each application and each type of machine can be considered a unique user, with different needs and different network “expectations.”
In the absence of tickets, visibility tools must provide continuous, up-to-date and accurate information about all aspects of the network—identifying faults, measuring latencies, and tracking available network resources such as bandwidth, for example. The information conveyed must be more than raw data, however, as it’s impractical to transfer, store and process those data and still reach conclusions on how to fix and improve the network behavior in a timely manner. The “art” in this context lies in finding the right balance between selectively reporting what’s known to be important and reporting that which is not known (or not yet known) to be important. The tools must further be able to flexibly export a wide set of network metadata to a wide range of collectors.
We can categorize visibility tools into two general types:
Networks based on TSN are usually more sensitive to network behavior changes, so in this blog we’ll focus on non-intrusive tools. We will discuss common approaches to network visibility and then consider TSN-specific network visibility tools needed.
Flow Monitoring
To balance the need to provide visibility information for every packet and to provide coarse/aggregated information about nodes, ports and other shared resources, the most common approach is to provide information about flows. Flows are not only a good balance between the two but also an easy entity to relate to, as they provide visibility into network usage of specific users and applications.
There is no single definition of a “flow.” Most define a flow as the packets that have the same 5-tuple (source and destination IP, protocol, and source and destination UDP/TCP ports), as it monitors each TCP/UDP session. Others prefer defining a flow based only on 2-tuple (source and destination IP). Providing visibility information on 5-tuples allows a collector to later calculate coarse metrics on 2-tuples, so it is better to collect this fine-grained information.
Performance Monitoring
Performance monitoring typically refers to tools that report latency and packet loss, as networking is ultimately about moving packets around quickly and safely. Given that performance is dynamic, visibility tools need to continually monitor and report status for performance to be evaluated and managed.
Total network latency is the sum of four components: propagation delay (a function of the distance signals travel over copper or fiber-optic cable), processing delay, queuing delay and transmission delay (also known as serialization delay, which is a function of port speed). Each networking node is expected to report its latency contribution (processing + queueing + transmission). Queueing delay is typically the largest contributor, by far.
All packets transmitted via a specific queue experience the same latency. To reduce the volume of visibility data, some argue that it is better to measure only queue latency, rather than measure the latency of each flow or packet. The queue-measurement approach ignores the scenario in which a “lucky” flow arrives to an empty queue and doesn’t experience the latency that other flows in that queue do. In such cases, reporting the latency on a per flow basis is more meaningful.
Packet loss is the second key performance metric. Reporting must include drop reasons, number of drops, what was dropped and when it was dropped. The common approach for reporting packet loss is on a per flow basis for packets that share the same fate, e.g., all packets that go through same ports and queue.
Resource Monitoring
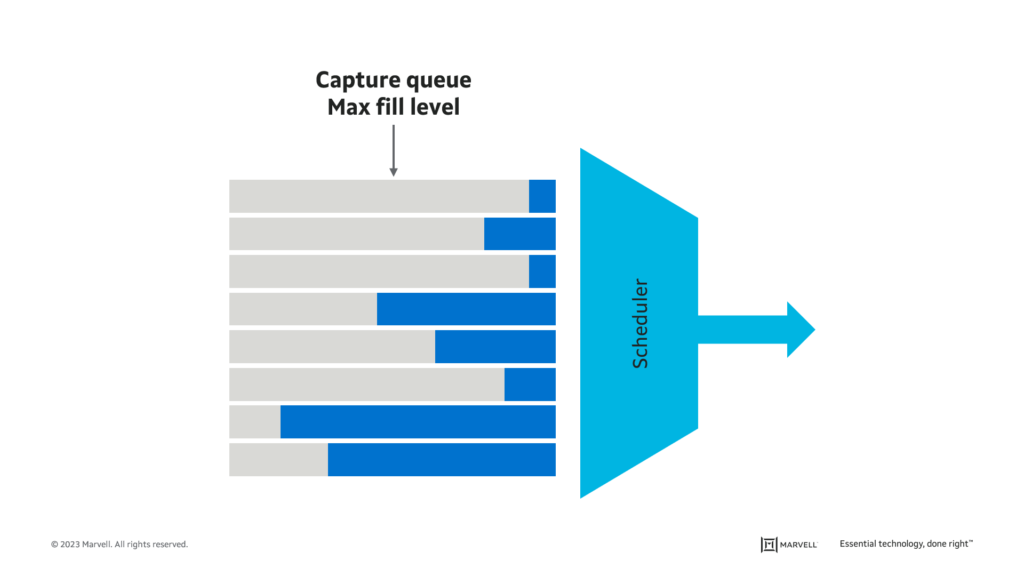
Monitoring switch resources is critical to identify situations in which resources are becoming fully consumed and performance is about to degrade. Switch resources include its forwarding tables, internal measurement units like the switch counter pool, packet buffers and the Ethernet links themselves.
The best approach for reporting resource usage depends on how dynamic the changes are. Port utilization, for example, continuously changes, so it must be continuously reported. On the other hand, counter pool usage rarely changes, so intermittent reporting is sufficient.
Timing and synchronization monitoring
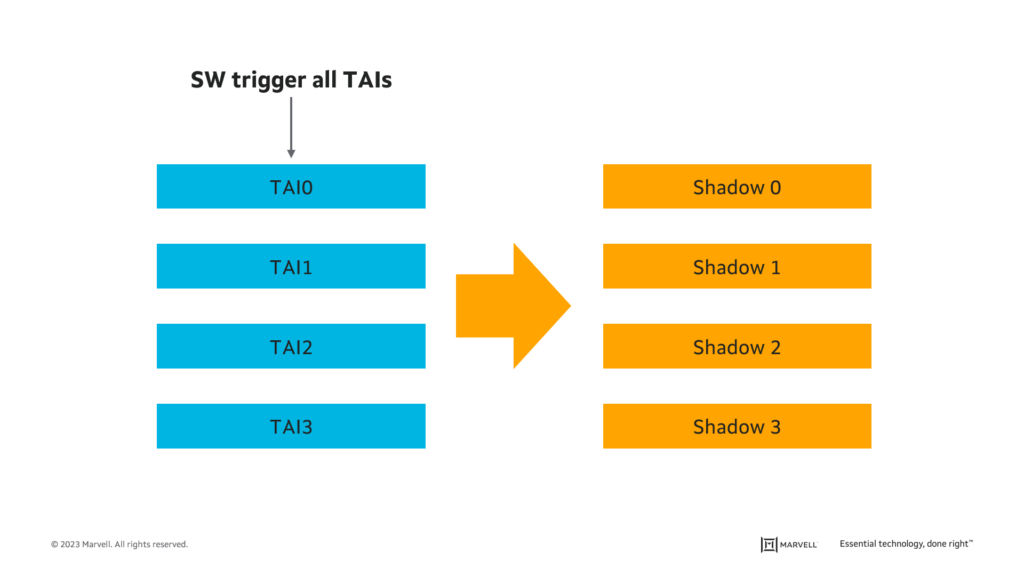
Timing and synchronization for time-sensitive applications is defined by IEEE 802.1AS-2020. It defines a mechanism to synchronize all the devices on an industrial network. A malfunction of this capability may cause machines to operate asynchronously, creating physical collisions that can cause a facility to stop operation. To monitor synchronization and detect failures and misconfigurations, Ethernet switches should:

Frame preemption monitoring
Frame preemption is a mechanism that interrupts the transmission of a long, low-priority packet to allow an “express” packet that just arrived to be transmitted first before transmission of the remainder of the low priority (preemptable) packet. This mechanism, defined in 802.1Qbu/802.3br, is essential to ensure low latency for time-sensitive applications. It is especially important for ensuring low latency traffic across the low-speed 100Mbps and 1Gbps ports common to industrial networks.
Networking devices must monitor such time-sensitive flows and detect misbehaviors ahead of time by:

Time-Aware Scheduler monitoring
The IEEE 802.1Qbv Time-Aware Scheduler (TAS) allows the network to guarantee bandwidth, quality of service and timely delivery of applications across the network. For it to work properly, it should be configured across multiple networking devices. The failure of one element may disturb the proper behavior of the entire network.
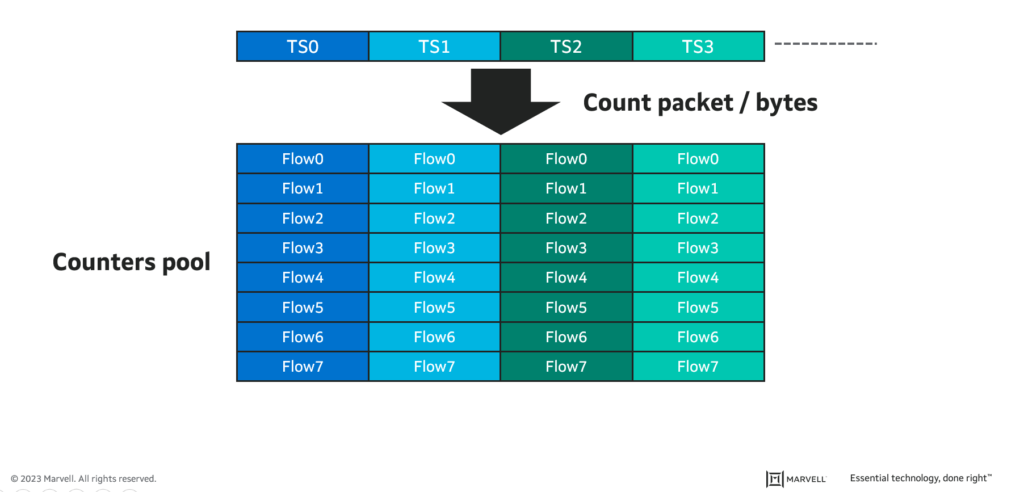
Industrial switches are expected to monitor each of the configured time slots and to provide accurate latency measurements and accurate packet and byte counters for each flow sent to each time slot.

Networks with TAS typically include per stream filtering and policing (as defined in IEEE 802.1Qci) to protect the time-sensitive network from misbehaving and misconfigured devices connected to the network.
Such device misbehavior can be detected by collecting and analyzing comprehensive statistics. Statistics should be available per gate and flow or per gate and time slot. Reporting should include the number of packets and bytes passed and dropped, packets exceeding service data unit (SDU) size, and gate interval max octet exceeded.
Frame replication and elimination monitoring
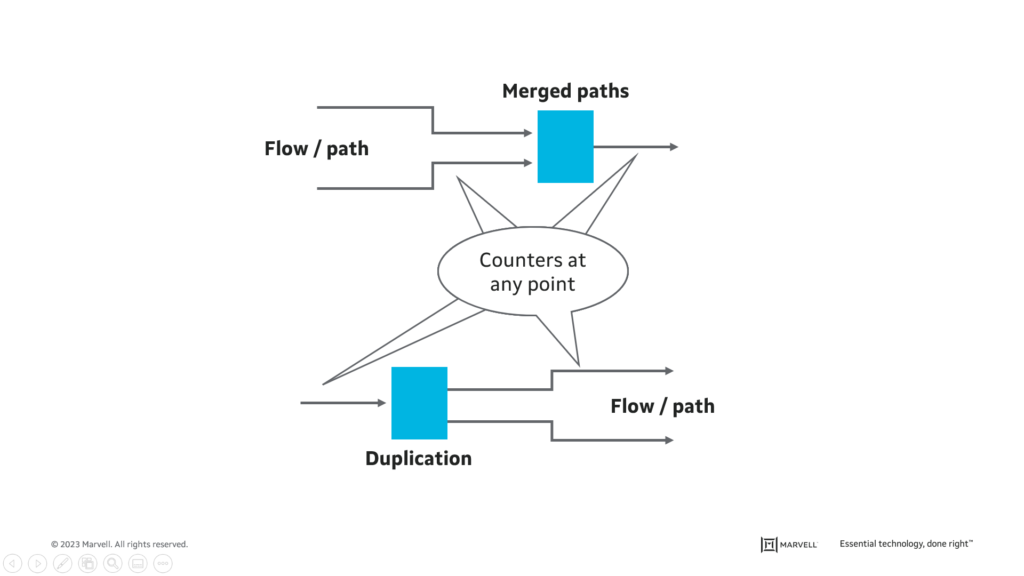
Industrial networks should not only provide low and predictable latency but should also provide ultra-high reliability. IEEE 802.1CB defines Frame Replication and Elimination for Reliability (FRER), which is a mechanism to send every packet twice, over two different routes, to protect against the rare case that a packet is dropped. FRER operation requires eliminating the copy of the packet, so the end-device will receive only a single copy of the packet.
This standard is used for applications that are sensitive to packet drops and cannot tolerate the extra latency incurred when using traditional retransmission techniques. To verify that this capability is functioning properly, the following is implemented:

Operators of industrial networks are adopting TSN technologies to create a unified network that satisfies the needs and requirements of both the IT and OT departments.
Monitoring and visibility tools are critical to ensuring the industrial network operates smoothly and autonomously, with minimal human intervention. The new capabilities introduced with TSN require additional time-aware, flow-specific, and highly accurate network visibility tools to provide a comprehensive networking solution for Industry 4.0 networks.
State-of-the-art TSN-enabled Ethernet switches are the foundation of these networks.
Marvell’s new family of Prestera DX1500 TSN switches combines the latest enterprise-grade visibility tools with unique, dynamic, and accurate visibility of time-sensitive operational technology solutions.
Tags: enterprise network visibility tools, Industrial Networks, Industrial switches, Industry 4.0, industry 4.0 revolution, Networks with TAS, Time-Sensitive Networking, TSN technologies, TSN-enabled Ethernet switches, TSN-specific network visibility tools